
To start this course, you will learn about the different elements of the Power BI service and its fundamental components. You will also take your first look at desktop client and web app interfaces.
Topic Objectives
In this topic, you will learn:
- What Power BI is
- About the Power BI building blocks
- About the desktop client interface
- When to expect Power BI updates
Power BI is a collection of software, apps, and services designed to aggregate data so users can easily report on and interpret it. It offers many easy-to-use visualization and reporting tools. It also supports a wide range of data sources, from Facebook analytics to Azure data warehouses and everything in between.
There are three key parts to Power BI, which are all supported by the Power BI service:
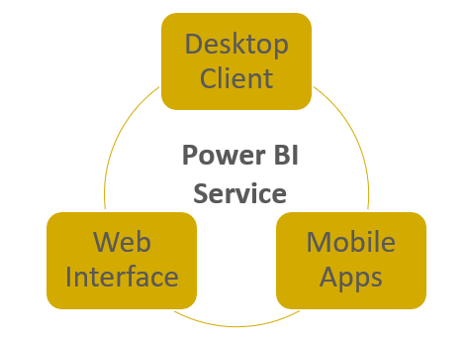
Power BI also offers many different connectors so that its data can be shared with, and embedded into, Microsoft apps such as SharePoint and Teams.
Typically, users will start by creating a report in Power BI from connected data sources. The user then publishes that report to the service and shares it, making it available to other users via the web interface and mobile apps. The web interface and mobile apps also support dashboards, which provide a customized summary of report visualizations, and workspaces, which allow users to create custom dashboard collections.
The Building Blocks of Power BI
Let’s look at how all these elements work together in Power BI.
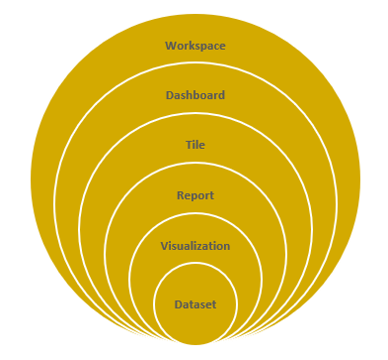
It all starts with the dataset, which simply means the data you have connected to. This might be an Excel workbook, Facebook analytics, and/or an SQL database (just to name a few of the options). These datasets are then added to reports as visualizations, which present that data in a graphical way.
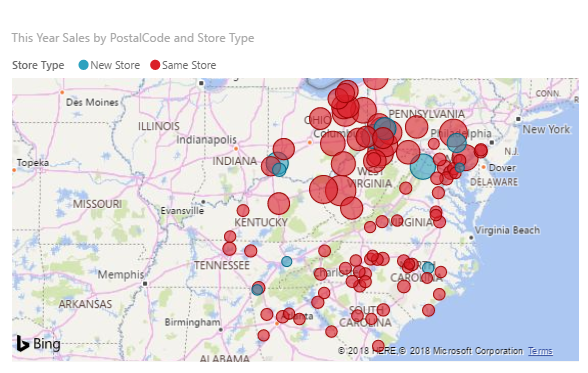
For example, sales by region might be presented as a map, with a bubble representing each amount:
The Power BI web and mobile apps go a step further with dashboards, which allow you to collect visualizations from different reports into a single location. (The desktop client does not offer this feature.) For example, you might have a different dashboard for each region in your company, or a separate dashboard for revenue and expenses.
Each dashboard is made up of tiles, which are simply visualizations linked back to the original report. These dashboards can be collected into workspaces.
The Power BI Desktop Interface
To use the Power BI desktop client, get the installation package from the Windows Store or the Power BI website (https://powerbi.microsoft.com/en-us/desktop/). Once you have installed it, double-click the icon to start it:

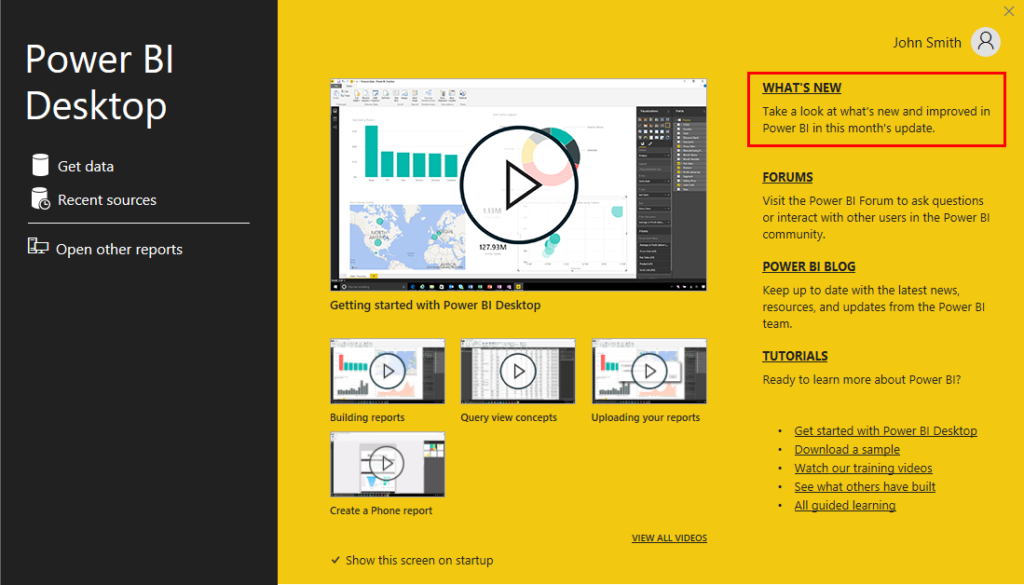
The app will then launch and display the Start screen:
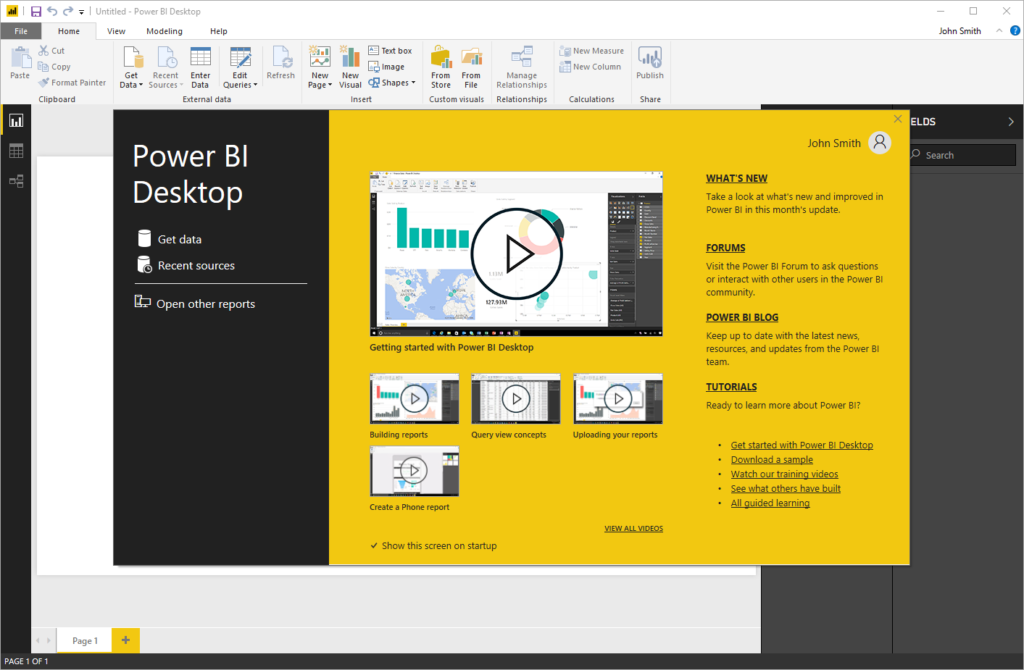
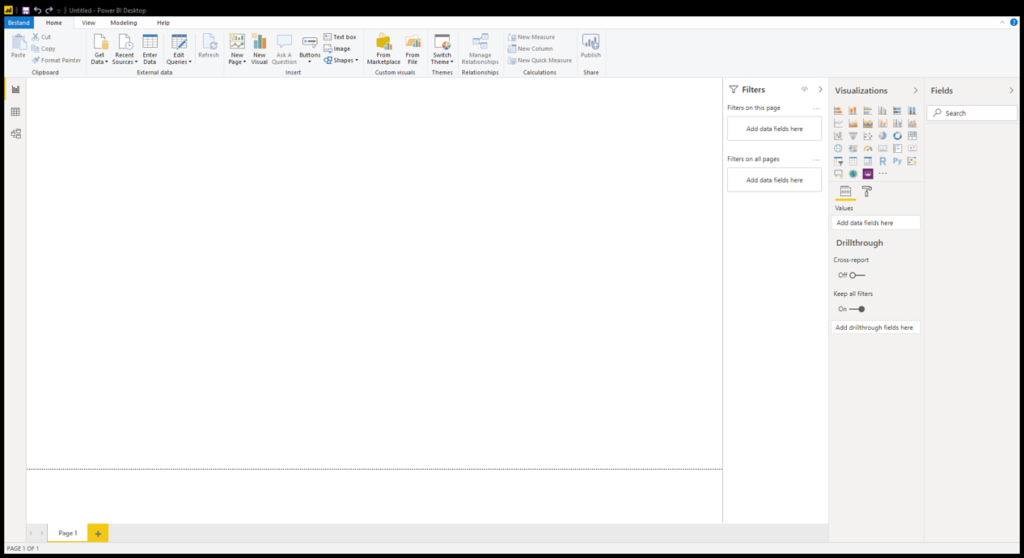
Here, you can explore what’s new, find help, watch videos, and create and open reports. When this window is closed, the main interface will be displayed:
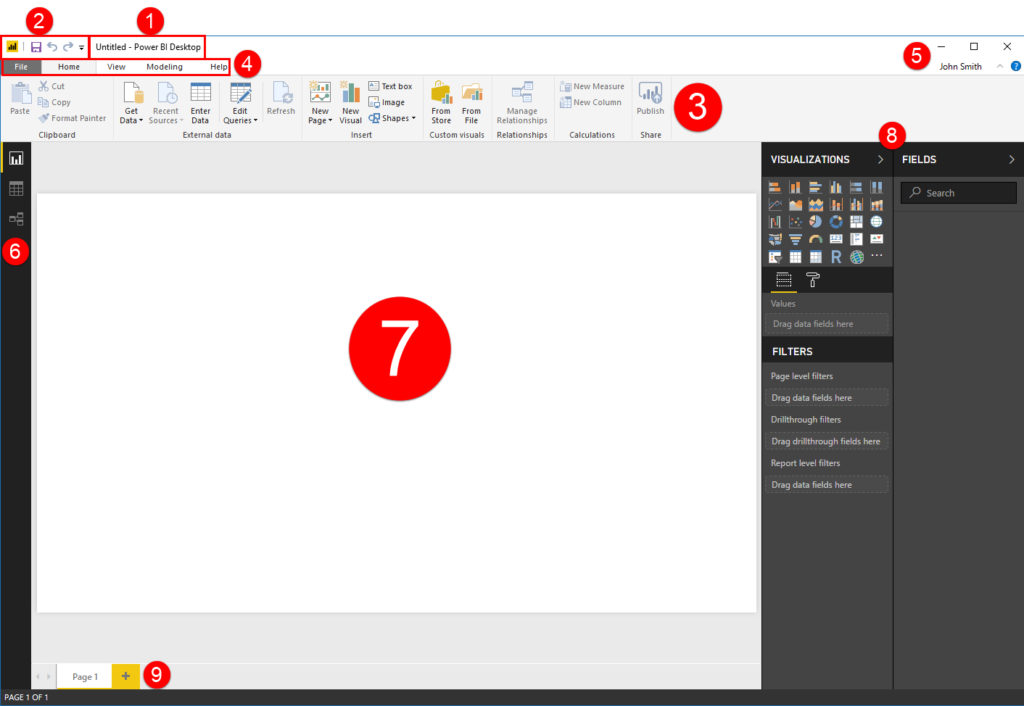
Let’s explore each part.
1: Title Bar
The name of the program and the currently open file are displayed here.
2: Quick Access Toolbar
As the name implies, the Quick Access toolbar gives you quick access to frequently used commands. Use the drop-down arrow to remove icons or change its position.
3 and 4: Ribbon Interface
Displays tab commands organized into groups. If you click the different tabs (4), you will see the commands (3) change. Some of the commands might be grayed out (unavailable) if they are only usable in certain situations.
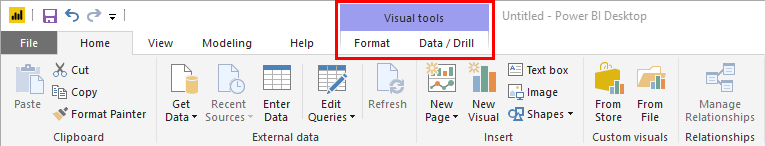
Power BI also features contextual tabs, which appear when you are working with a specific object or group of information. These tabs are usually denoted by a different color:
5: Program and Account Management
Using the top set of icons in the top right-hand corner of the screen, you can change how the ribbon is displayed, minimize the window, maximize/restore the window, or close the current file. Below this, you will see your Microsoft account name (or a command to sign in), a chevron to minimize the ribbon, and a help icon.
6: Navigation Pane
From top to bottom, choose if you want to work with reports, data, or relationships.
7: Canvas
The data in the currently open file will be shown here. In Report view, this is where you will create and work with visualizations.
8: Task Panes
Additional commands appear in these vertical task panes. Here, you can see the two default task panes: Visualizations/Filters and Fields.
9: Page Navigator and Status Bar
Navigate through and manage pages in your report.
Important Information About Power BI Updates
The Power BI desktop client is updated monthly and the web app is updated weekly. Therefore, the images you see in this course may differ from the current services. However, the general instructions should stay the same.
If you are using the desktop client, the Start screen will prompt you if updates are available. You can also access a link to see new features:
Activity 1-1: An Introduction to Power BI
In this activity, learners will install and launch the Power BI desktop client. They will also explore the Power BI web app. You can download the Power BI Desktop by clicking on this link : Download Power BI Desktop
| 1 | Download and install the Power BI desktop client from the Microsoft Store: |
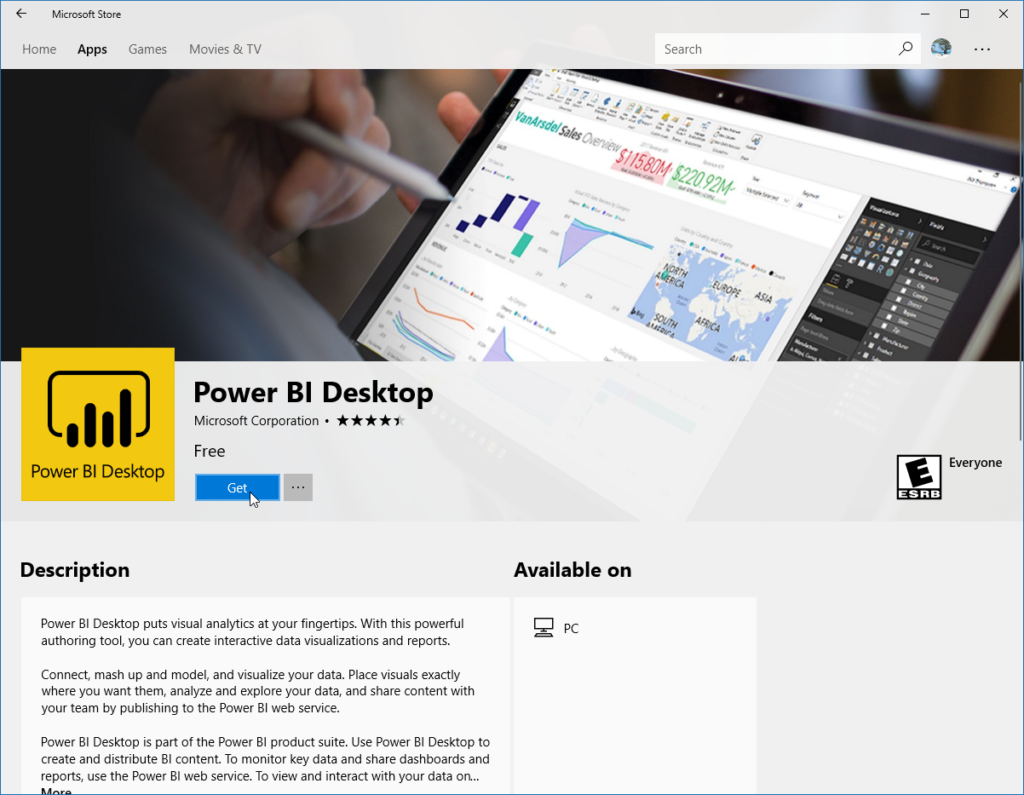
(If you have already downloaded and installed the app, skip to the next step )
| 2 | Double-click the icon to launch it: |
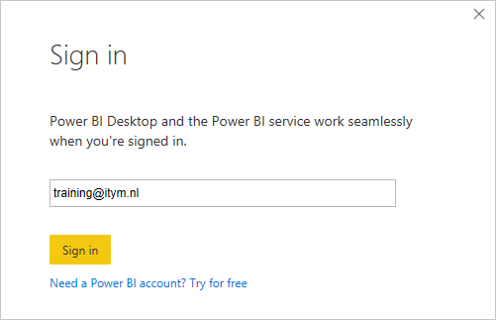
| 3 | Click “Sign in:” |
(If you are already signed in, close the Start screen and skip to Step 6.)
| 4 | Enter your email address and click “Sign in:” |
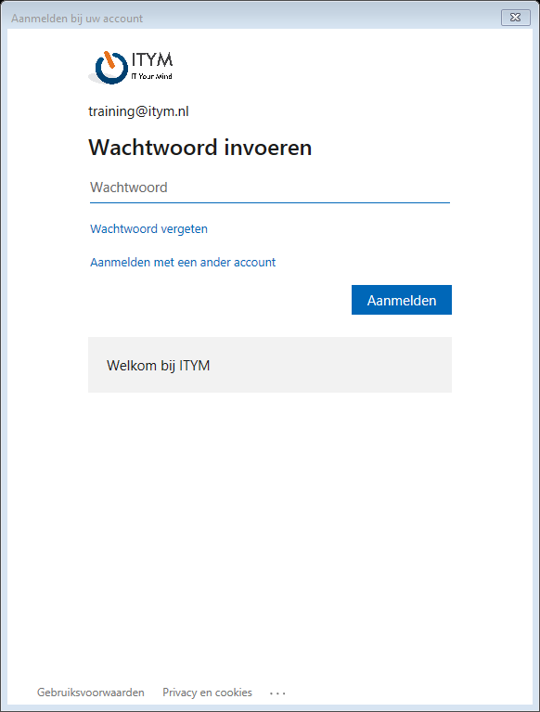
| 5 | Enter your password and click “Sign in:” |
| 6 | The Power BI interface will now be displayed. Review the parts of the interface and move your mouse over some of the commands to see more information: |
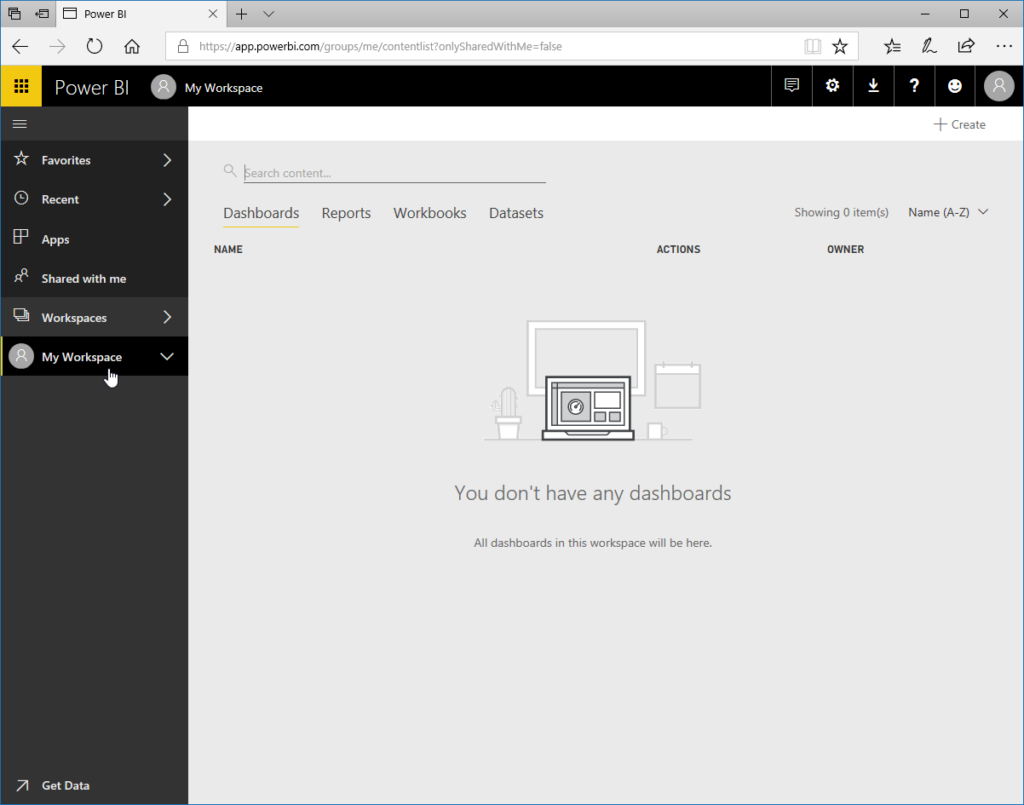
| 7 | Next, launch Microsoft Edge and navigate to https://app.powerbi.com/. Sign in when prompted to see the Power BI web app: |
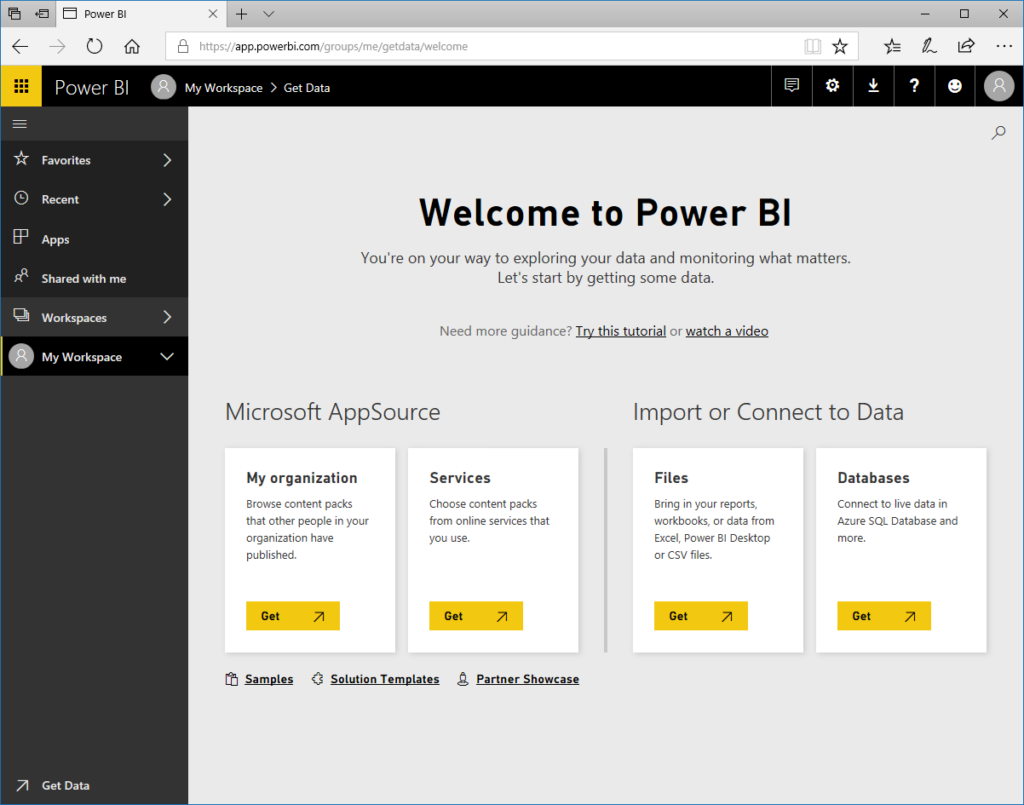
| 8 | Take a moment to explore the app: |
| 9 | Close all open windows to complete this activity. |